A Closer Look at the November Release of SkyGIS
Railway clearance built around the track, wall checks against the design, deviation value grids, orthographic images from point clouds and true-to-scale map sheets.
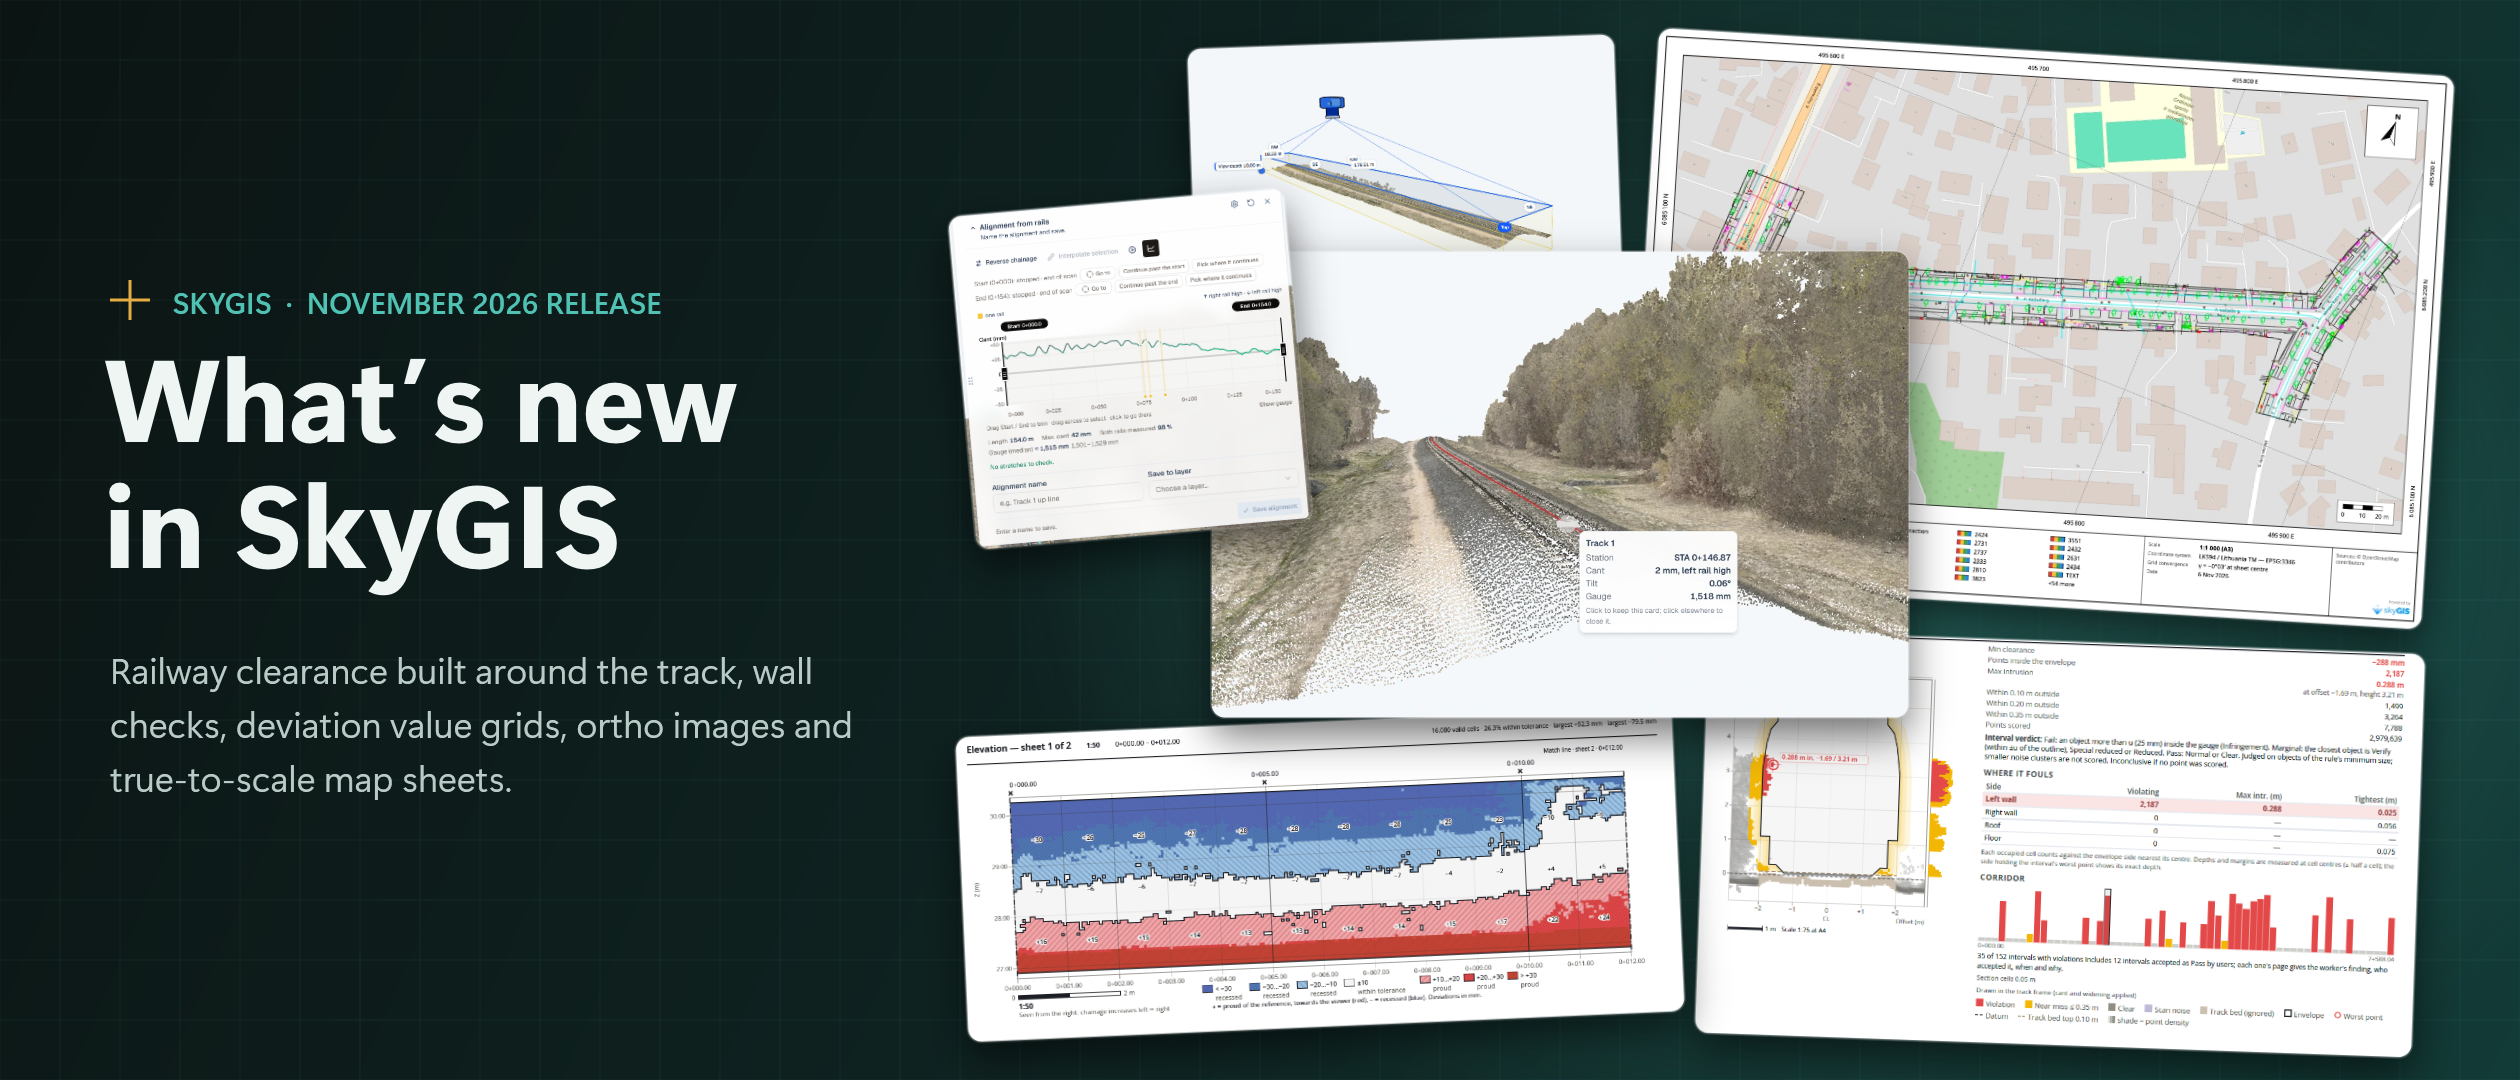
Our Largest Release So Far
At SkyGIS, we build our tools around the questions surveyors and site teams ask every day: is the structure where the design says it should be, and can I prove it on paper? The November release is our largest update so far. It brings more than a hundred new capabilities and a long list of fixes and refinements, from railway clearance and wall inspection to printing and sharing.
This article walks through the headline changes. They are delivered through the web application, with nothing to install.
Railway Clearance, Built Around the Track
Clearance analysis now starts from the rails themselves. The new Rail Tool follows the running rails through the scanned point cloud, even on noisy captures, and draws an alignment from them complete with the measured cant. It opens in a movable, minimisable window and works through a check list of stretches and ends. Users can trim, jump between sections and edit a saved alignment later. Two precision settings, Faster and More detailed, and a configurable track gauge let teams balance speed against detail. Tracing runs in the browser with live progress, and it can be stopped at any point while keeping what has been traced.
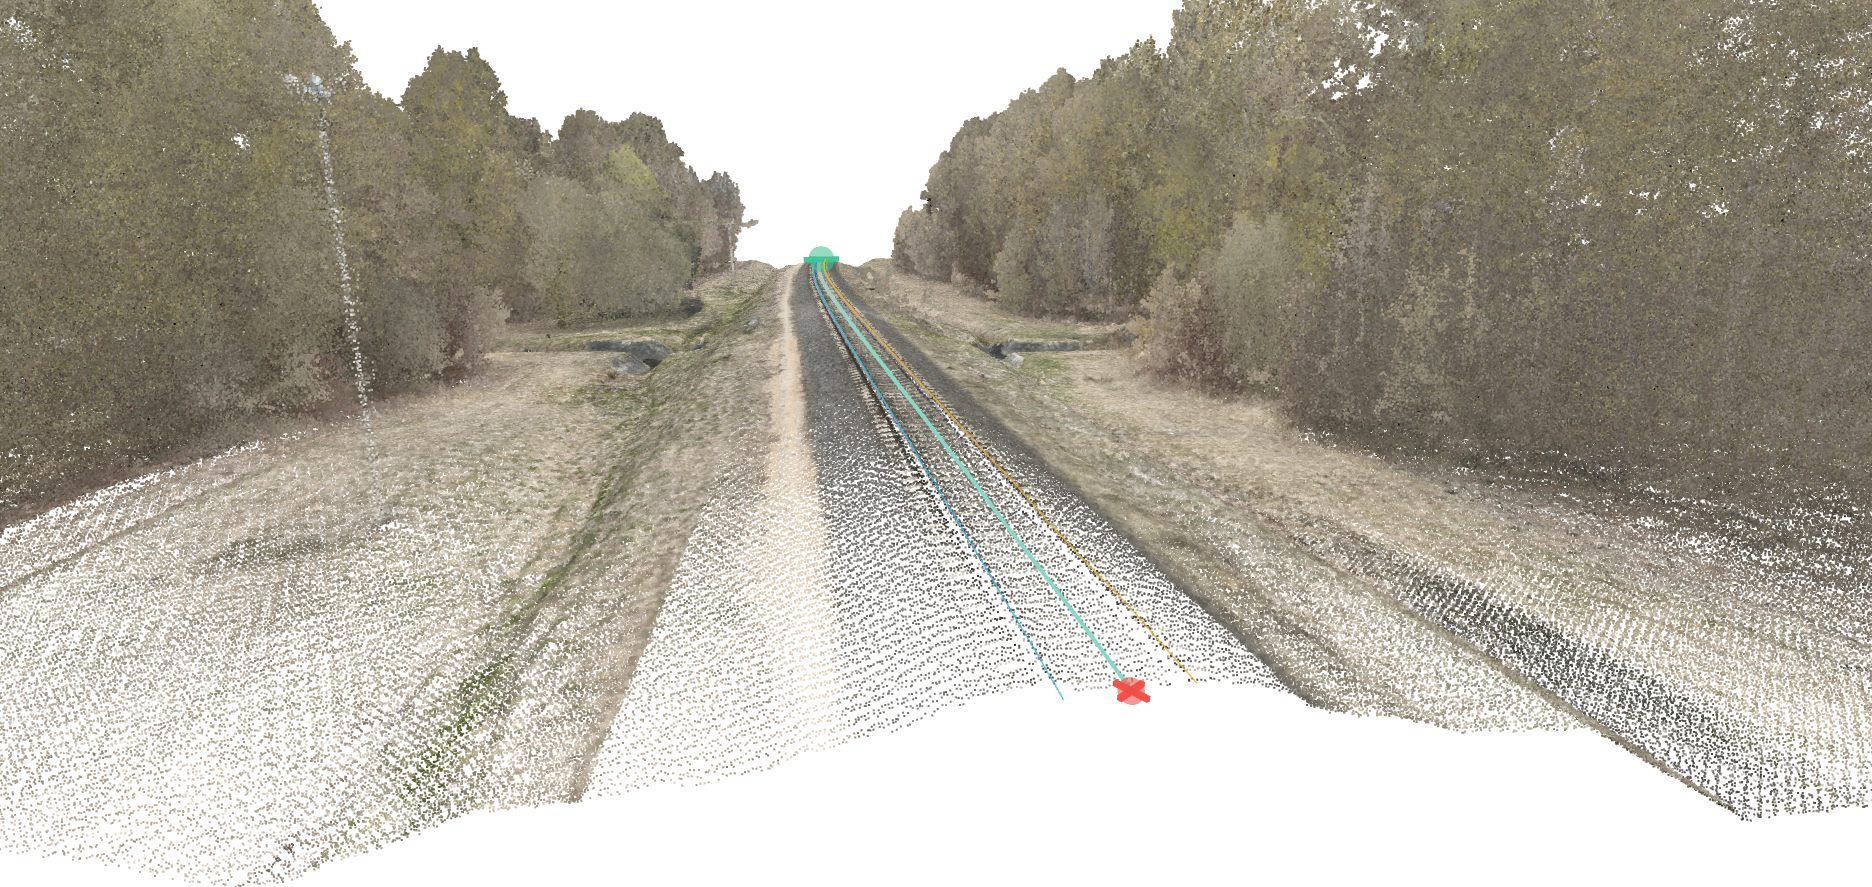
The gauge itself now behaves like a real one: it tilts with the measured cant and widens on curves. Results follow an object-based verdict with millimetre categories and versioned rules, and near-miss bands can be set for each run. Sparse sheets and low clutter are classified as noise, and the cross-section shows the noise and the top line of the track bed, so it is clear what was excluded and why. Hungarian gauge profiles join the presets, and the profile picker is now grouped by region.
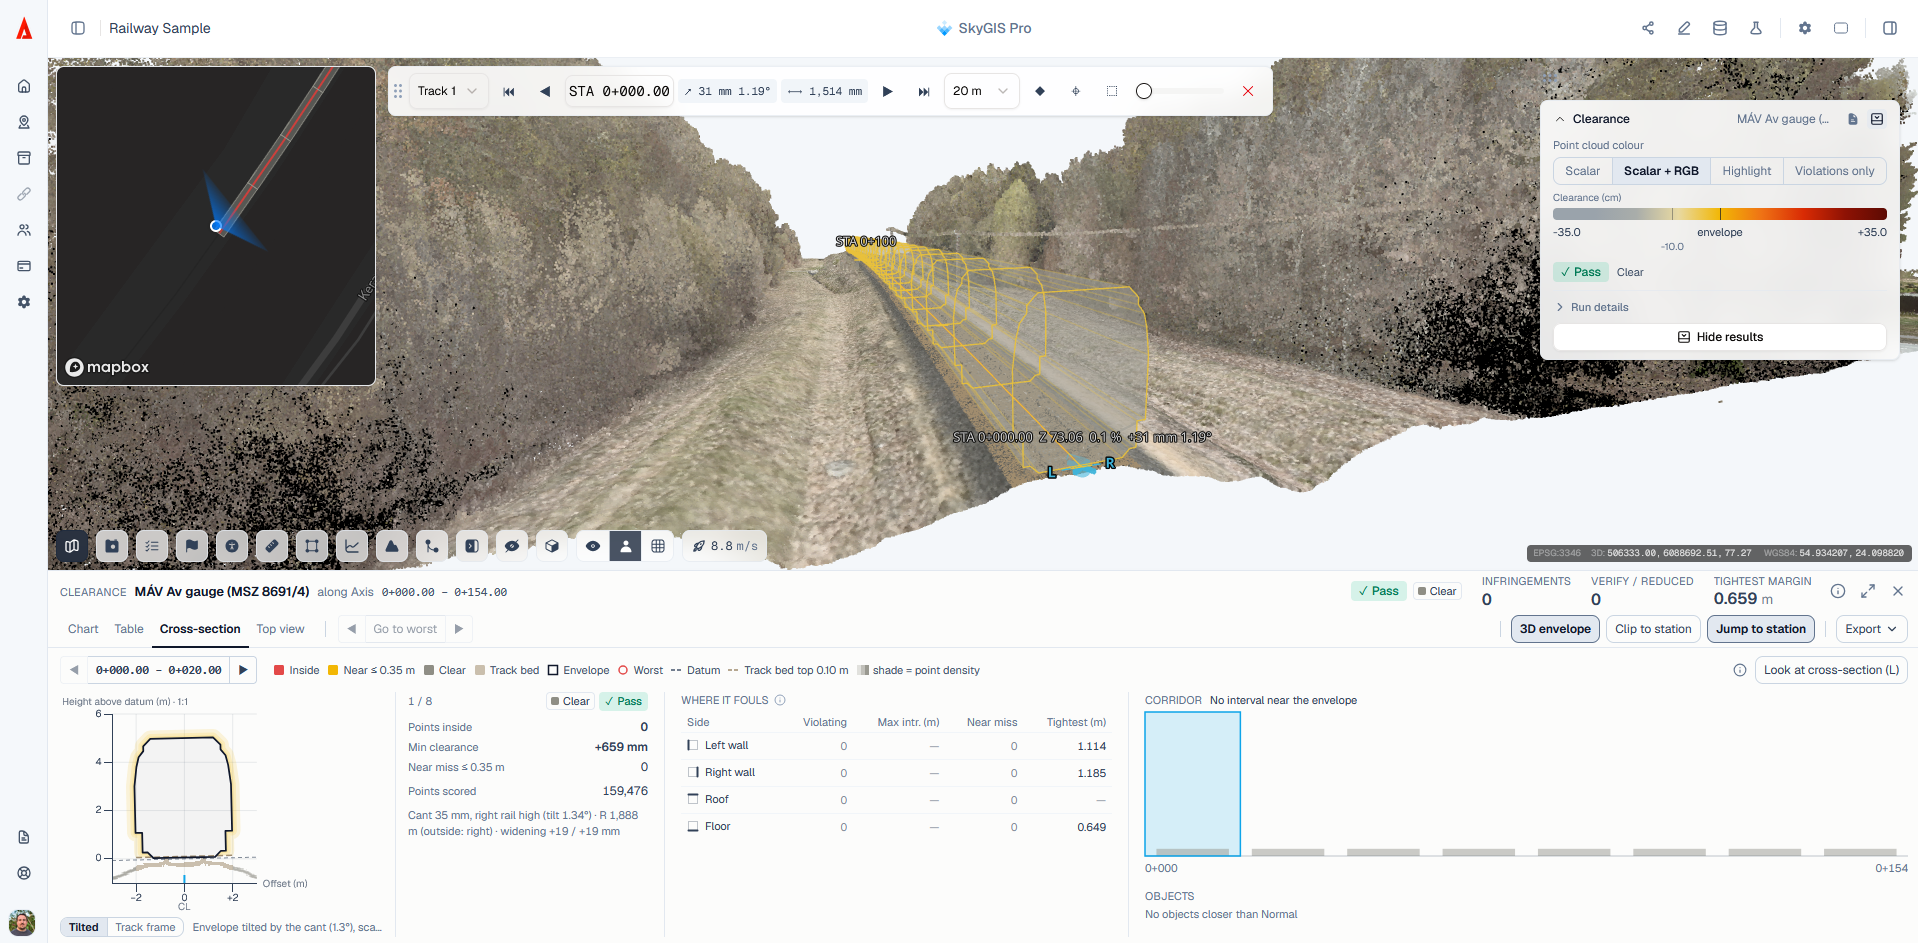
Editors can also accept intervals as Pass, for example where the survey train itself stood within the gauge. A reason is required, the measured figures are kept, and every acceptance is shown in the dock, in the tables and in the PDF summary. Nothing is hidden. The point cloud defaults to the new Scalar + RGB colour mode, and a top view strip and 2D map hover cards make long corridors quicker to review. Large surveys are streamed and cropped to the corridor on the server, so even very long lines process reliably.
Check Walls Against Their Design
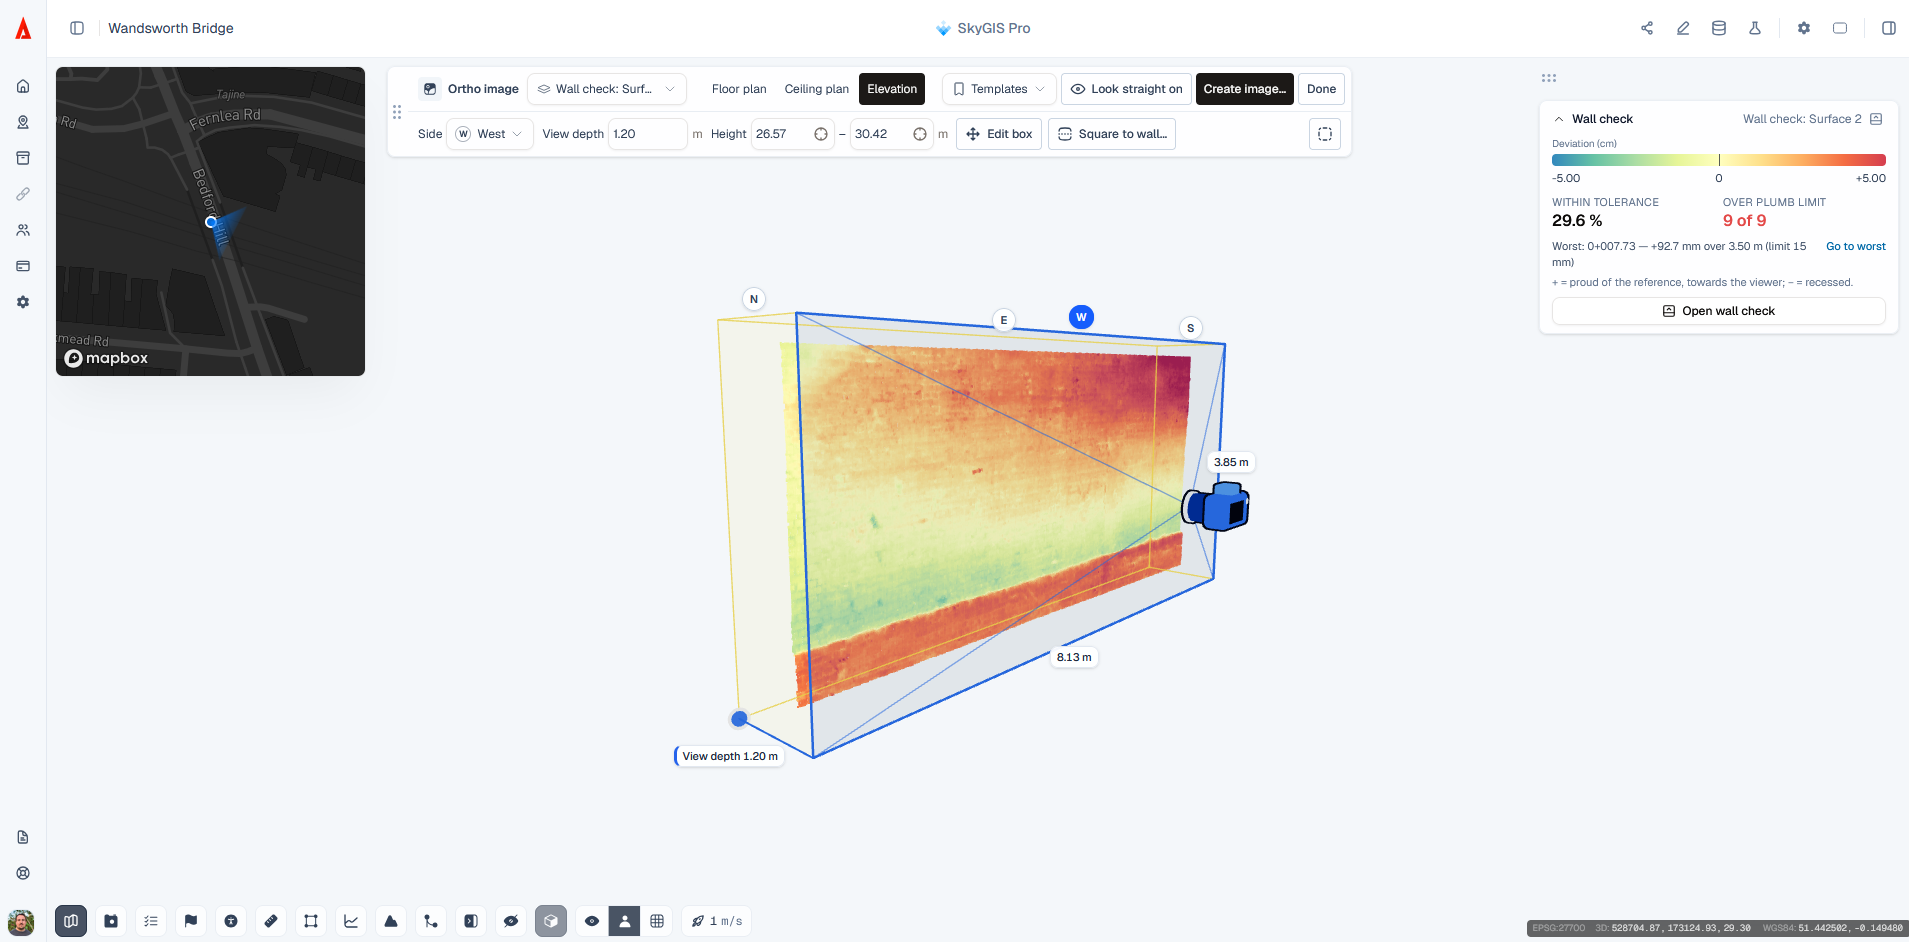
The new Wall Check runs from the Compare Surfaces dialog in a dedicated wall mode. SkyGIS traces the wall line and its outside face from the design and measures the horizontal deviation of the as-built wall against it. When the scan clearly shows which side was surveyed, the viewing side is picked automatically.
Results open in their own dock, with an elevation view of the wall, a section view and station-by-station figures. The PDF report prints elevation sheets, a plumb table and station pages, and users can set the section exaggeration for exports. The full result can also be taken into CAD as a DXF file.
Read Deviation as a Grid of Numbers
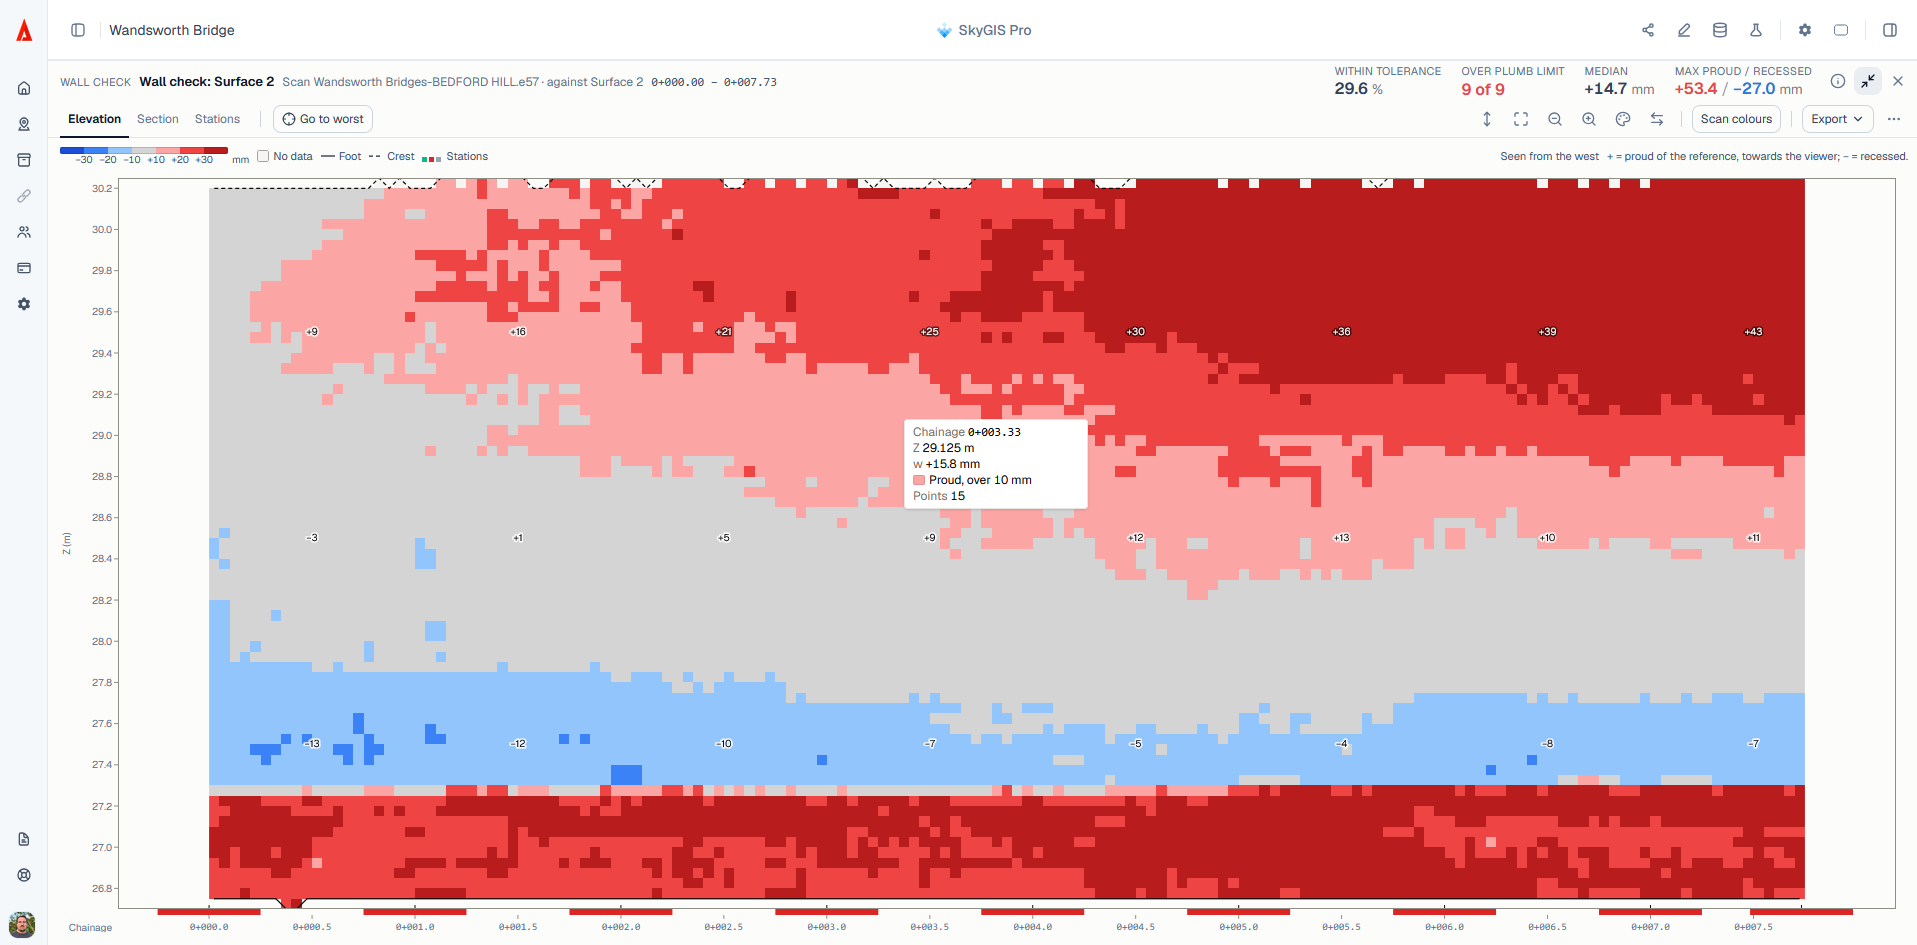
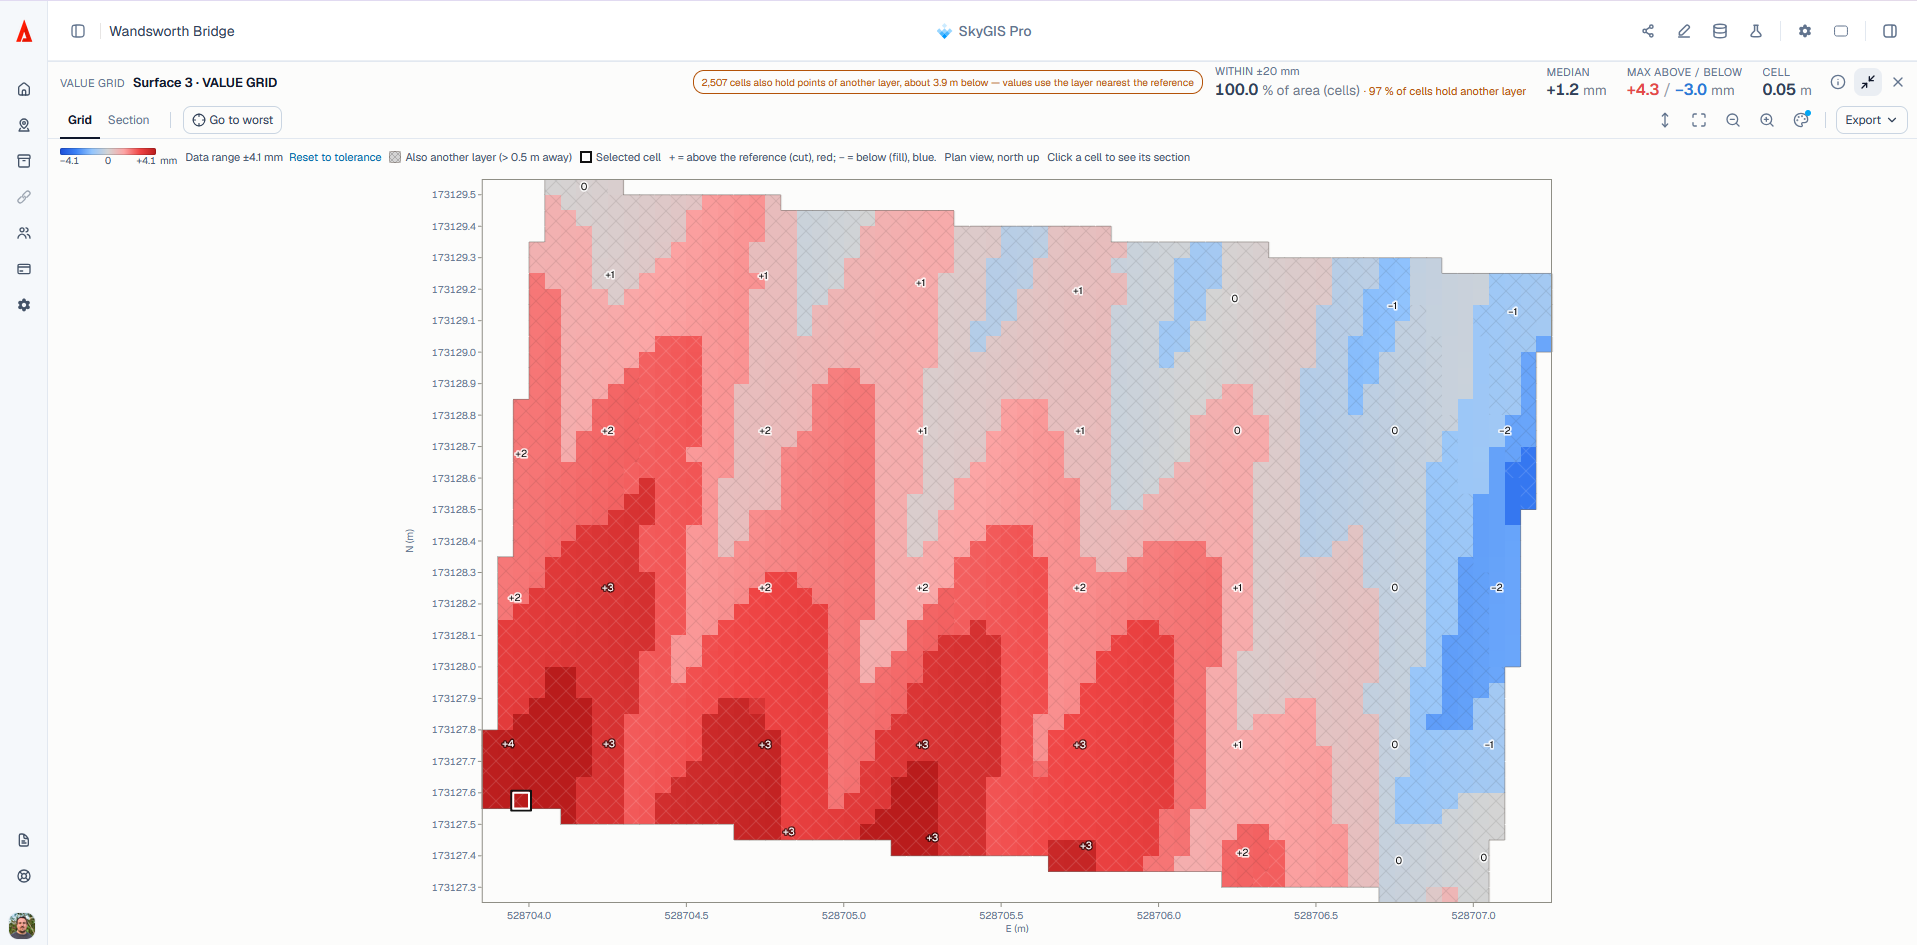
Every eligible deviation run now produces a value grid: a flat chart of the surface divided into cells, each showing the median deviation of the measured points within it. It suits floors, slabs and facades, where a colour map alone does not give the figures a contractor needs.
The grid opens in a results dock with Grid and Section tabs, a minimap showing the section line, and buttons to step through cells or go straight to the worst one. On screen, users can switch between tolerance bands, the data range or a custom colour scale, and view a facade from the other side without mirroring it. Cells where a second layer of points sits behind the measured surface are marked, not hidden. Value grids can be exported to DXF and CSV, and the deviation PDF report now includes true-to-scale value grid sheets.
Orthographic Images from Point Clouds
The render mode has been rebuilt as an ortho image tool. Users frame a clip box and produce straight-on orthographic images of it: floor plans, elevations of every face of a box, reflected ceiling plans or plan drawings with a cut band. Plan views in a projected metric coordinate system also produce a GeoTIFF and a map layer.
The run dialog suggests a pixel size and hole fill from the density of the cloud. An Align to wall option squares the box to a picked wall. Each image downloads with world files and a DXF that places it at its real 3D corners, and optional PDF sheets are printed at a chosen scale in the SkyGIS report style.
Print the 2D Map to Scale
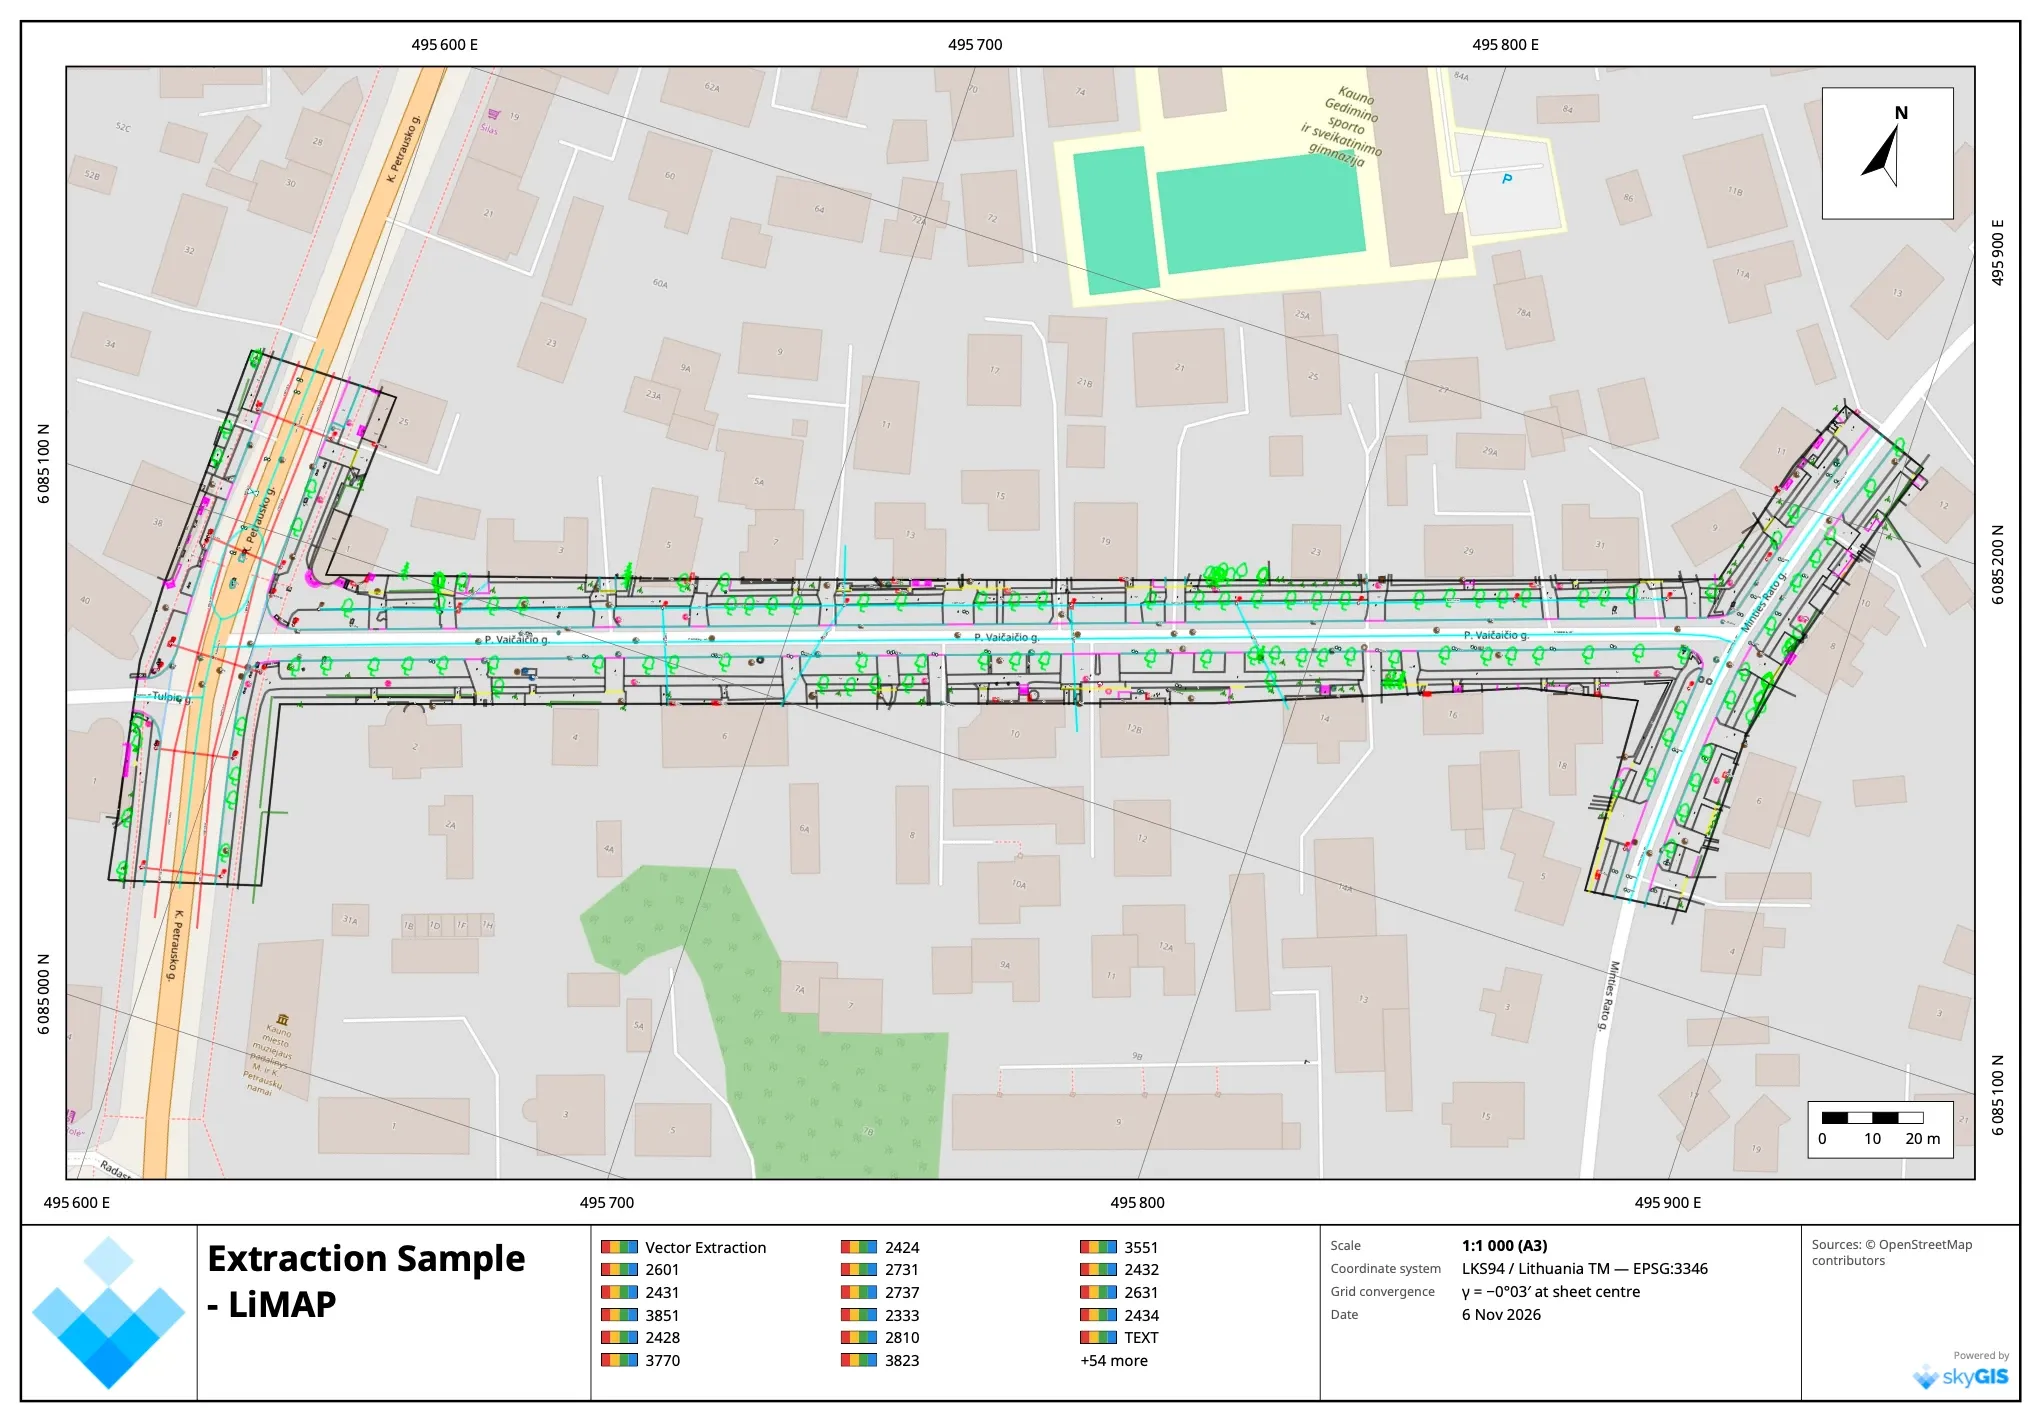
The 2D map can now be exported as a true-to-scale PDF map sheet, georeferenced as a GeoPDF so it opens in place in GIS software. The sheet can be rotated, and the north arrow and scale bar sit on the map frame. A reset-north compass appears whenever the map is rotated. Hover cards on the map now share one consistent style, with one card per click on alignment bands.
Faster Everyday Work in the Viewer
Many smaller improvements make daily work quicker. Surfaces can now be outlined with any number of corners. The position, size and orientation of a clip box or surface can be typed in, and a clip box can be aligned to two picked points. Flying speed is adjustable, with a default sized to the scene, and pano capture positions appear while flying and open with a click. Orthographic zoom goes out far enough to show a whole line, and double-clicking re-centres the orbit while drawing.
On the analysis side, a GeoTIFF can be generated from an existing point cloud, point-cloud analyses can run on selected classes only, and classification codes can be named per organisation and per layer. Crest lines can be extracted from point clouds. E57 imports now keep return numbers and GPS time. The stockpile tool ignores cables and noise above the pile and has its own PDF report. Elevation profiles use a fixed vertical exaggeration across the chart and the PDF. GeoTIFF generation from large clouds is considerably faster.
Share links now carry the sharing organisation's plan, so visitors see the same analysis results the team sees, still strictly read-only. Each link can group its layers by type.
Contact the SkyGIS team to see the November release in a live demonstration, or to discuss how these workflows fit your projects.